Debug Console
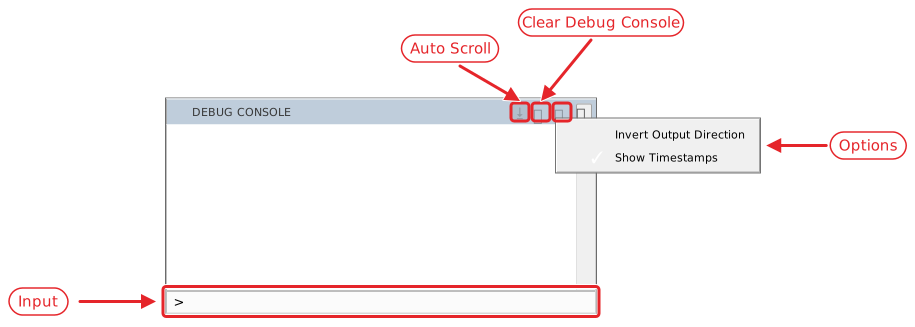
The Debug Console captures output from Debug.Print statements and other debug-layer messages written at runtime, displaying them in a scrollable log. Debug.TracePrint writes here too when the Trace Output project setting is ${DEBUG} rather than the path of a log file.

 Auto Scroll
Keeps the newest output in view. While Auto Scroll is on, the console scrolls to each new line as it arrives: to the bottom, or to the top when Invert Output Direction is ticked. It is on each time the IDE starts, and the button is highlighted while it is on.
Scrolling away from the newest line turns Auto Scroll off, so earlier output stays in view while the program goes on writing. Scrolling back until the newest line shows turns it on again.
Clicking the button turns Auto Scroll off until it is clicked again. Scrolling back to the newest line then leaves it off.

 Clear Debug Console
Empties the console. Debug.Cls does the same thing from code.

 Options
- Invert Output Direction
- Show Timestamps

 Input
Input
The row along the bottom of the console runs one line of code when ENTER is pressed. CTRL + G moves the keyboard focus to it, and the up arrow key (ARROWUP) brings back earlier lines, the most recent first.
?and an expression prints the value, the same way Debug.Print does, andDebug.Printitself works too. Several expressions separated by commas or semicolons are spaced as Debug.Print spaces them.- A statement runs:
idx = 5gives a variable a new value, and a procedure’s name, such asModule1.Mainor justMain, calls it. - An expression on its own is refused:
igives(compile error: Expression is neither used nor assigned).
The console repeats each line, then shows its output and how long it took, as (time taken: …). A line that is refused shows the compile error instead.
While the program is stopped — at a breakpoint, after a step, or at a run-time error — the line runs inside the procedure selected in the Call Stack pane. It can read and change that procedure’s local variables, and the Variables pane shows the change. With the calling procedure selected instead, the failing procedure’s variables are unknown: ? i gives (compile error: Unrecognized symbol 'i'). With nothing running, the row still evaluates expressions and calls procedures.
At a run-time error, running a line in the console removes the error panel. When a run-time error stops the program describes what to do then.