Call Stack
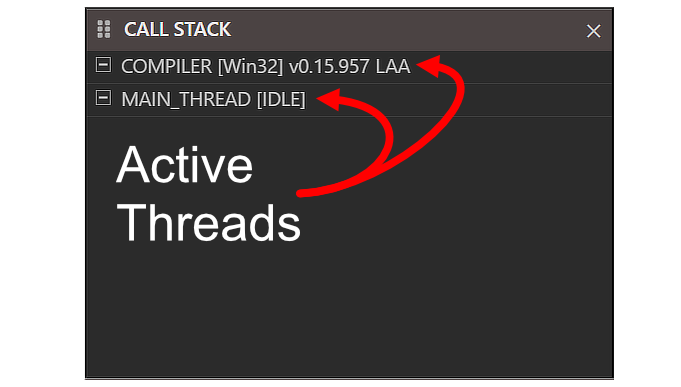
The Call Stack pane lists the active chain of procedure calls at the current execution point during a debugging session, with the most recent call at the top. Clicking an entry navigates the editor to that call site.
Calls are grouped by thread rather than listed flat. Each active thread is a top-level row that expands to show that thread’s own frames, and each row names the thread and its current state — COMPILER [Win32] and MAIN_THREAD [IDLE] in the screenshot above. The threads are listed whether or not a debugging session is running, so a pane showing thread rows with nothing beneath them, as above, means no call frames are currently on any stack.